
Double Top
30-Second Definition
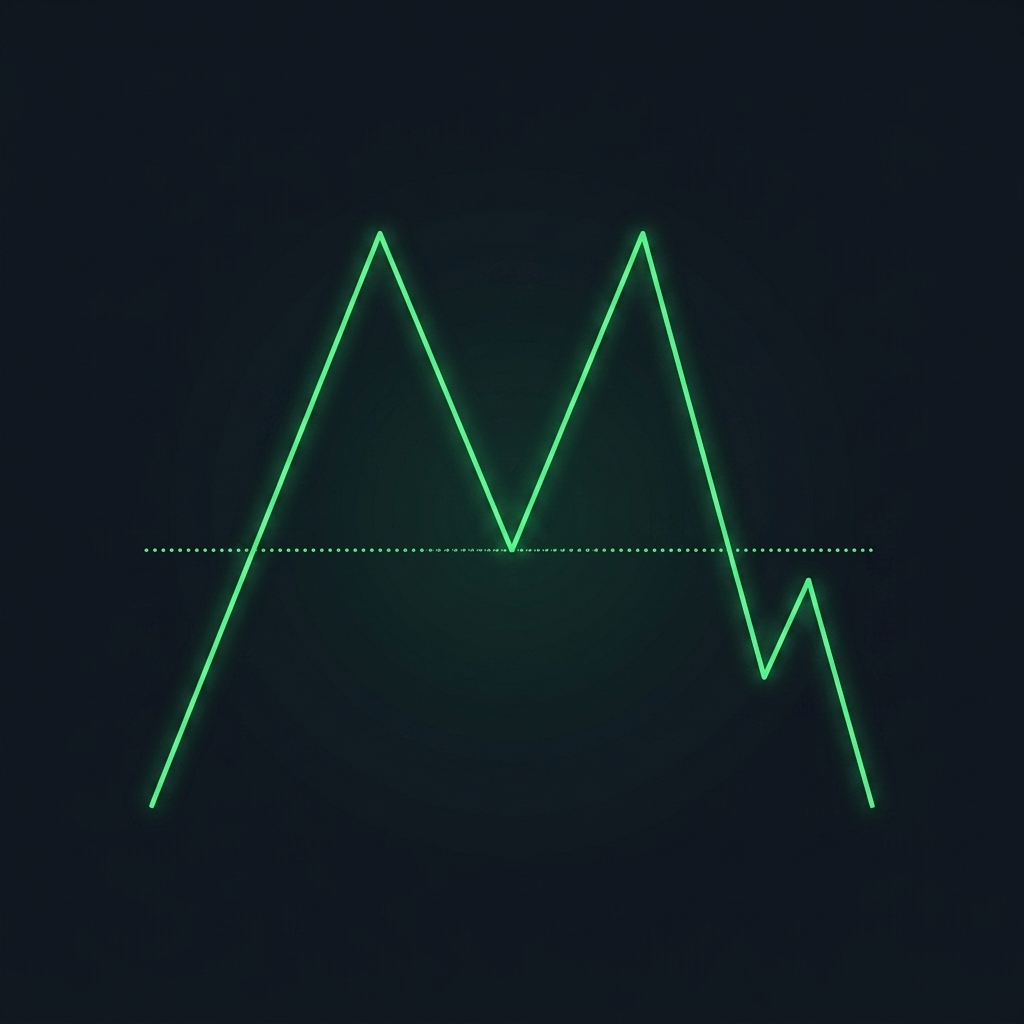
A bearish reversal market structure pattern where price reaches a high, pulls back, and then returns to reject that exact same high, forming an 'M' shape on the chart.
Why It Matters
The Double Top is one of the most universally recognized retail chart patterns. It signifies that buyers attempted to push the price past a specific resistance level twice and failed both times, indicating that sellers have taken control of the market. The resulting structure looks like the letter “M”.
However, because the pattern is so obvious, it is a prime target for Smart Money manipulation. When a Double Top forms, retail traders aggressively sell, placing their stop losses tightly above the two peaks. This creates a massive pool of Buy-Side Liquidity. Institutions will frequently push the price slightly above the Double Top to trigger all those stop losses before actually executing the bearish reversal.
Visual Explanation
Real Trading Example
Gold (XAUUSD) pushes up to $2,050 and violently rejects, dropping to $2,030. The $2,050 level is established as the first peak.
A few hours later, buyers push the price back up to $2,050. It taps the level and immediately begins forming a red bearish candle. A textbook Double Top has formed. Retail traders everywhere enter short positions, placing their stop losses at $2,055.
Before dropping, the market suddenly spikes to $2,056. The retail traders are stopped out. Their stop losses provide the exact liquidity the institutions need to fill their massive short positions. The price then crashes from $2,056 all the way down to $2,000. The Double Top played out perfectly, but the early retail sellers were swept out before the move occurred.
Common Mistakes
Common Mistake
Entering on the Second Peak: The most common mistake is shorting the absolute second the price touches the resistance level for the second time. The pattern is not confirmed until the price breaks below the “neckline” (the low point between the two peaks).
Professional Tips
Pro Tip
Trade the Sweep, Not the Pattern: Instead of blindly selling the Double Top, wait for the inevitable liquidity sweep. Let price poke slightly above the two peaks, trigger the retail stops, and then look for a lower-timeframe bearish Change of Character (CHOCH) to confirm the institutional reversal. You enter after the trap is sprung.
FAQ
Does a Double Top have to be perfectly even?
No. In fact, a perfectly even Double Top is highly suspicious and is usually engineered inducement. It is completely normal for the second peak to be slightly lower or slightly higher (a sweep) than the first peak.
What is the ‘Neckline’ of a Double Top?
The neckline is the horizontal support level drawn across the bottom of the pullback between the two peaks. In traditional technical analysis, the pattern is only considered valid and actionable once the price firmly breaks and closes below this neckline.
Can a Double Top fail?
Yes. If the overall macroeconomic trend is aggressively bullish, a Double Top may just be a brief pause for consolidation before the price breaks through the resistance and continues rocketing upward. Always align patterns with the higher timeframe trend.
Related Concepts
Still have questions? Ask TradeGuardian AI.
Get instant, cited answers from our proven library of frameworks and strategies.