
Double Bottom
30-Second Definition
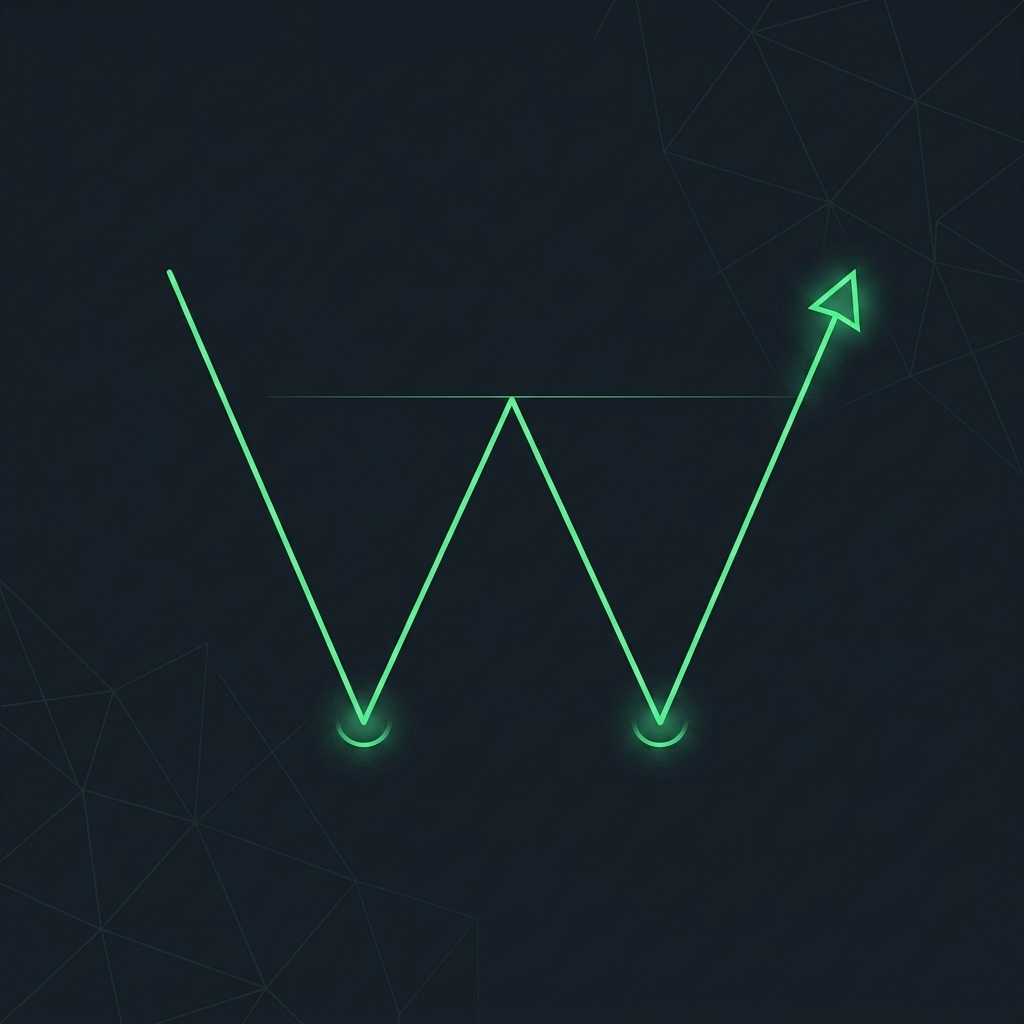
A bullish reversal market structure pattern where price drops to a low, pulls back up, and then returns to reject that exact same low, forming a 'W' shape on the chart.
Why It Matters
The Double Bottom is the bullish equivalent of the Double Top. It visually represents a “W” on the chart, indicating that sellers attempted to push the price through a support floor twice, but buyers overwhelmed them both times. This signals a high probability that the downtrend is exhausted and a bullish reversal is imminent.
In Smart Money Concepts (SMC), a Double Bottom is viewed as a massive pool of Sell-Side Liquidity. Retail traders are taught to buy the second touch of the bottom and place their stop losses slightly below it. Institutions will frequently push the price just below the Double Bottom to trigger those sell-stops (absorbing the volume to fill their own massive buy orders) before reversing the market upward.
Visual Explanation
Real Trading Example
Bitcoin (BTCUSD) crashes down to $40,000, finds massive buying support, and bounces back to $42,000.
A few days later, the price bleeds back down to exactly $40,000. Retail traders see the textbook Double Bottom forming. They instantly open long (buy) positions, placing their stop losses at $39,800.
Smart Money needs to accumulate a massive amount of Bitcoin before marking the price up. They intentionally drive the price down to $39,500. Every single retail stop loss is triggered, forcing the retail traders to sell their Bitcoin at a loss directly into the hands of the waiting institutions. Once the liquidity is absorbed, Bitcoin rockets upward to $45,000.
Common Mistakes
Common Mistake
Trading Every ‘W’ Shape: A Double Bottom is only valid if it occurs at the end of a prolonged downtrend or at a major higher-timeframe support level. If you see a random ‘W’ shape forming in the middle of a consolidating, sideways market, it is meaningless noise, not a high-probability reversal pattern.
Professional Tips
Pro Tip
Wait for the CHOCH: Never buy the exact moment the price touches the support level for the second time. Let the Double Bottom form, allow the market to sweep the lows if it needs to, and then wait for a bullish Change of Character (CHOCH) on a lower timeframe to confirm that the institutional order flow has actually shifted bullish.
FAQ
Does a Double Bottom have to hit the exact same price?
No. Market volatility means the second bottom might be slightly higher (showing early buyer strength) or slightly lower (a liquidity sweep) than the first bottom. Focus on the zone, not the exact pip.
What is the ‘Neckline’ of a Double Bottom?
The neckline is the horizontal resistance level drawn across the peak of the pullback between the two bottoms. A traditional technical trader waits for the price to break and close above this neckline before entering a long trade.
How is a Double Bottom different from relative equal lows (EQH/EQL)?
They are the same structural concept. SMC traders refer to Double Bottoms as “Equal Lows” (EQL) to emphasize that they represent a pool of liquidity rather than an unbreakable wall of support.
Related Concepts
Still have questions? Ask TradeGuardian AI.
Get instant, cited answers from our proven library of frameworks and strategies.